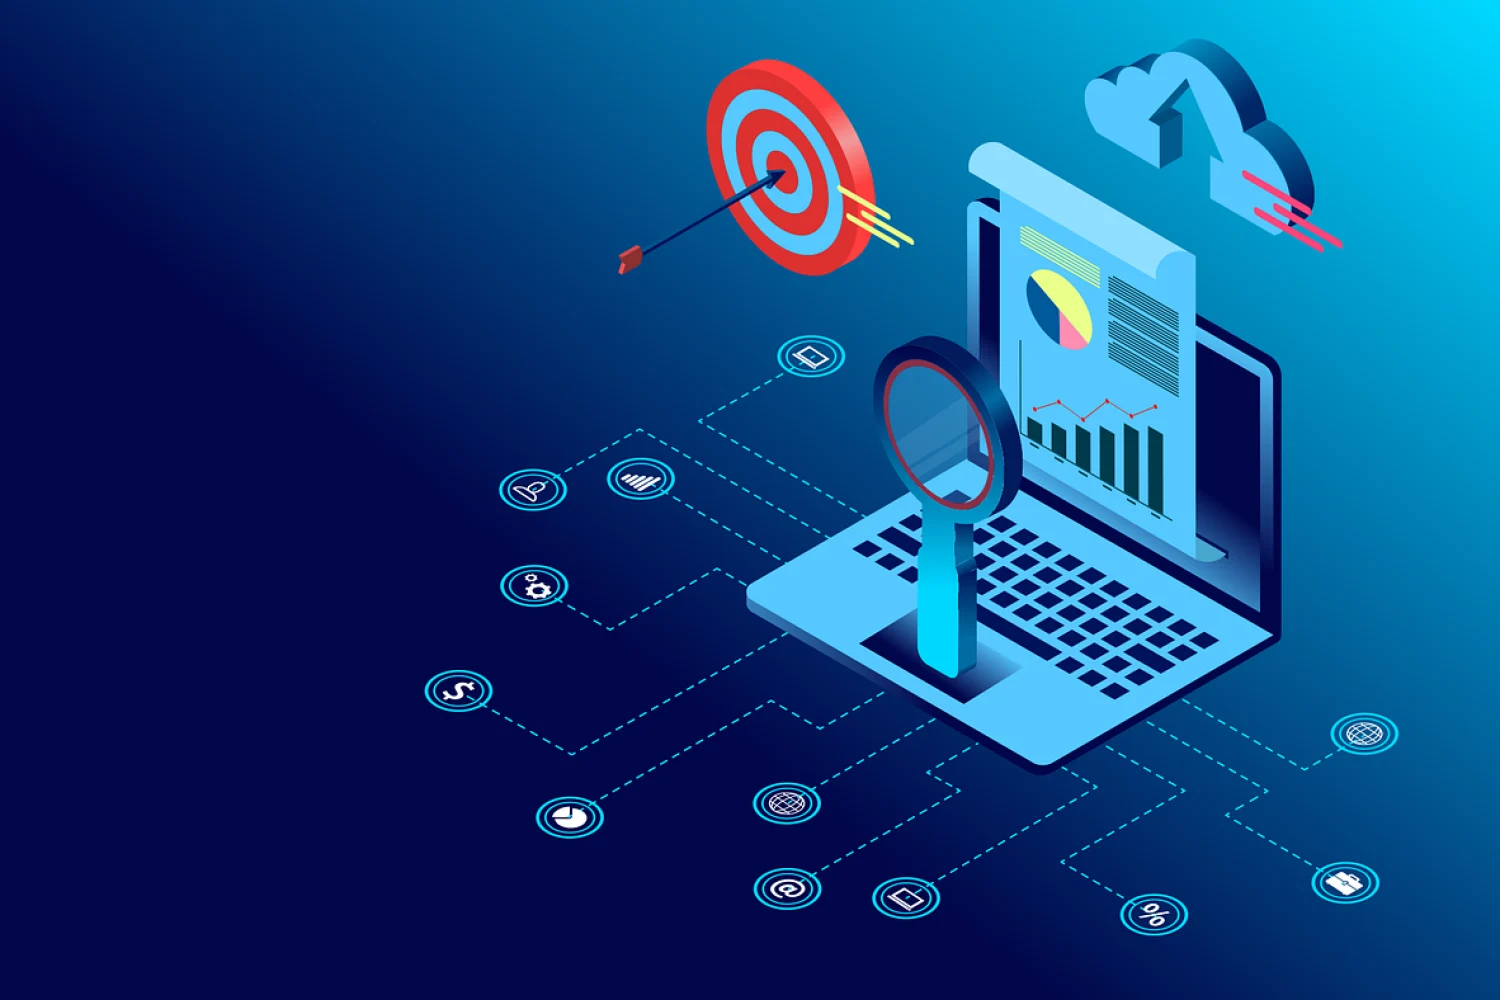
Reporting and presentation ensure that data is presented clearly and strategic decisions are made. Insight analysis improves business processes, and dashboard creation allows real-time tracking of performance metrics.
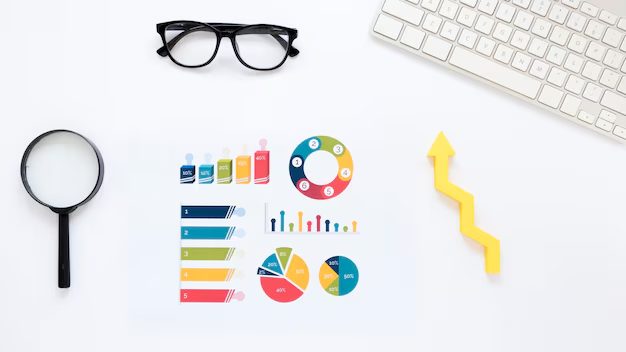
By visualizing your data through graphs, charts, and infographics, we make your data analysis easier and more understandable. Our visual analysis tools enable in-depth examination of your data and the extraction of meaningful results.
Thoughtful
By deeply understanding our customers' needs and goals, we provide tailored solutions. We listen carefully to every project, pay attention to details, and create the most suitable strategy. We develop campaigns that reflect the uniqueness of your brand and help you build strong connections with your target audience. We take meticulously planned steps to grow your business.
Professional
Professionalism is the cornerstone of all our work. With our team of experts, we provide services at the highest quality standards. We keep you informed at every stage of your projects, consider your feedback, and aim to exceed your expectations. We are your professional partner dedicated to helping you achieve your goals.
Customer-Centric Approach
Understanding and satisfying our customers' needs are at the core of our business. We actively incorporate customer feedback into our continuous improvement and development processes. At every stage of our work, we aim to provide you, our valued customers, with the best experience possible.
Measurable
Measuring and monitoring success is key to enhancing the effectiveness of our strategies. We track the performance of each campaign with detailed analyses and reports. Using data-driven approaches, we identify which strategies are most effective and make continuous improvements. We deliver measurable results that help you achieve your goals.
What Do We Offer?
Data Analytics
We analyze your data to derive meaningful insights that optimize your business processes and strategies. This helps you make data-driven decisions.
Visualization Tools
We use the most suitable visualization tools to present your complex data in an understandable and appealing way. Through graphs, charts, and infographics, we effectively communicate your data.
Reporting and Presentation
We support your data analyses with regular reports and professional presentations. By presenting your data clearly and effectively, we make it easier for you to make strategic decisions.
Insight Analysis
We improve your business processes and provide a competitive edge with insights derived from your data. These analyses make your strategic planning more effective.
Dashboard Creation
We create user-friendly and interactive dashboards that allow you to monitor your data analysis and performance metrics in real-time. This enables you to manage your business processes more efficiently.


